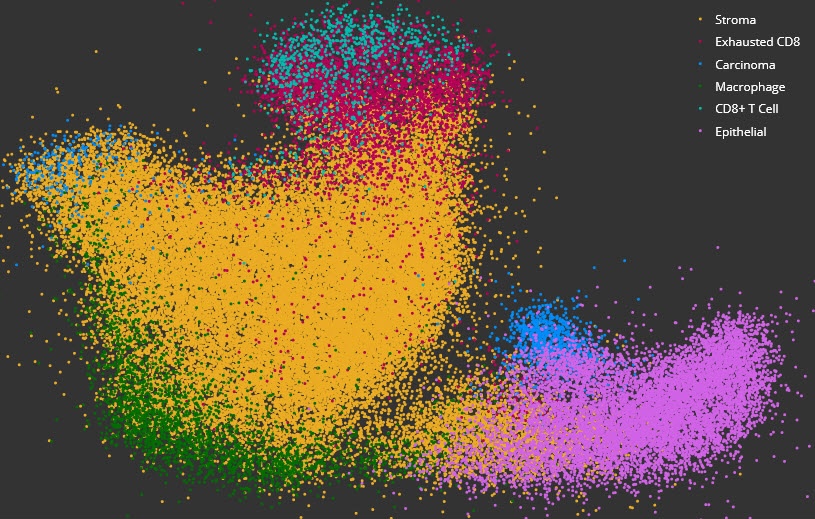
New! High Dimensional Analysis Module
Acquire deeper insights into complex data sets using dimensional reduction and unsupervised clustering with interactive plotting.
New! High Dimensional Analysis Module Read More »
Acquire deeper insights into complex data sets using dimensional reduction and unsupervised clustering with interactive plotting.
New! High Dimensional Analysis Module Read More »
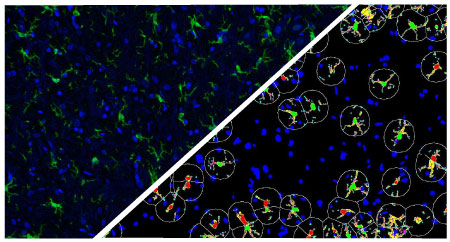
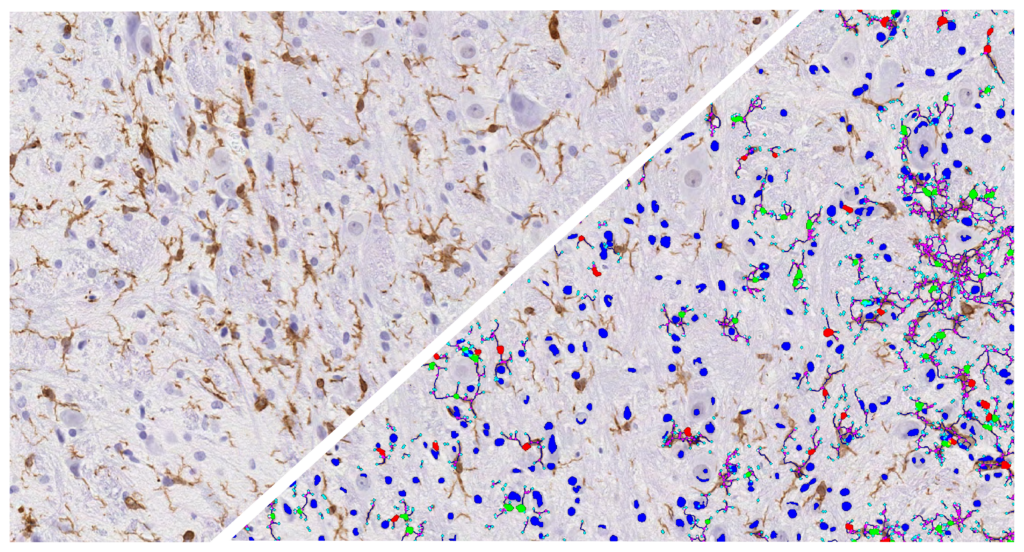
Quantify microglial activation in fluorescence based on detection of microglia, soma, and processes, by counting branch points, and by determining area, length, and thickness of processes.
Microglial Activation FL Read More »
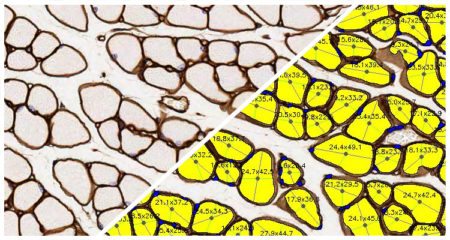
Quantify area, diameter, and perimeter of muscle fibers stained with laminin or other fiber membrane stains.
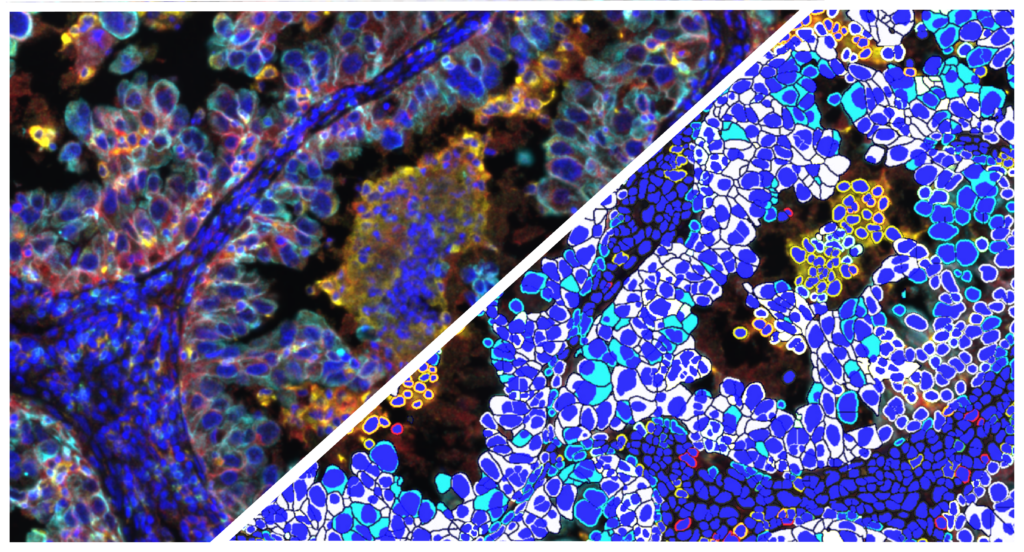
Quantify expression of an unlimited number of biomarkers in any cellular compartment – membrane, nucleus or cytoplasm.
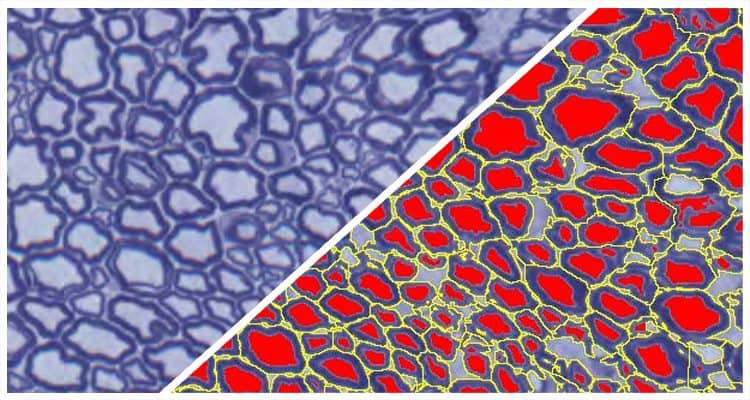
Quantify axons in nerve cross sections and calculate area, inner and outer diameter, myelin area, and G-ratio.
Axon Quantification Read More »
Quantify microglial activation based on length and thickness of microglial processes.
Microglial Activation Read More »
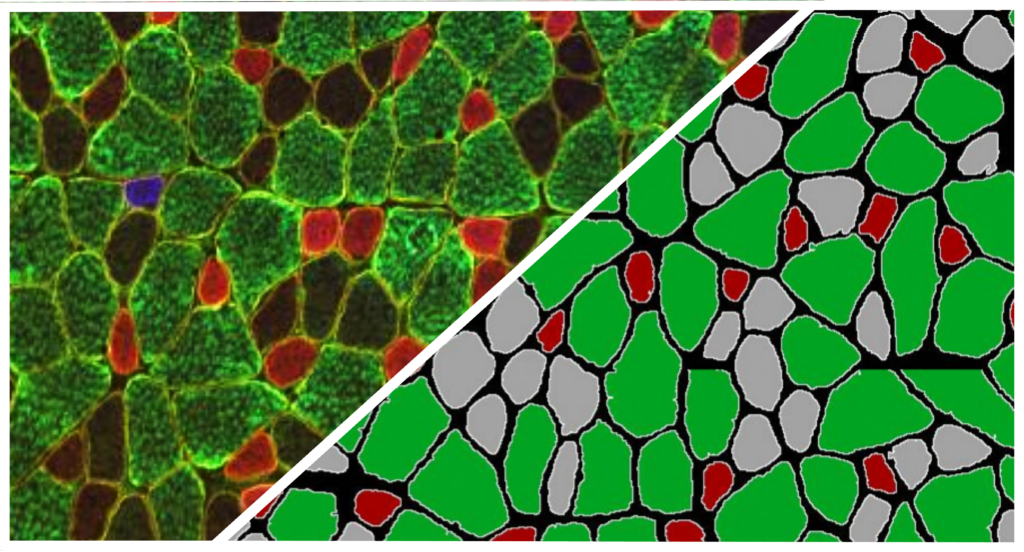
Quantify fiber or membrane positivity for an unlimited number of fluorescent dyes along with fiber diameter, perimeter, and area.
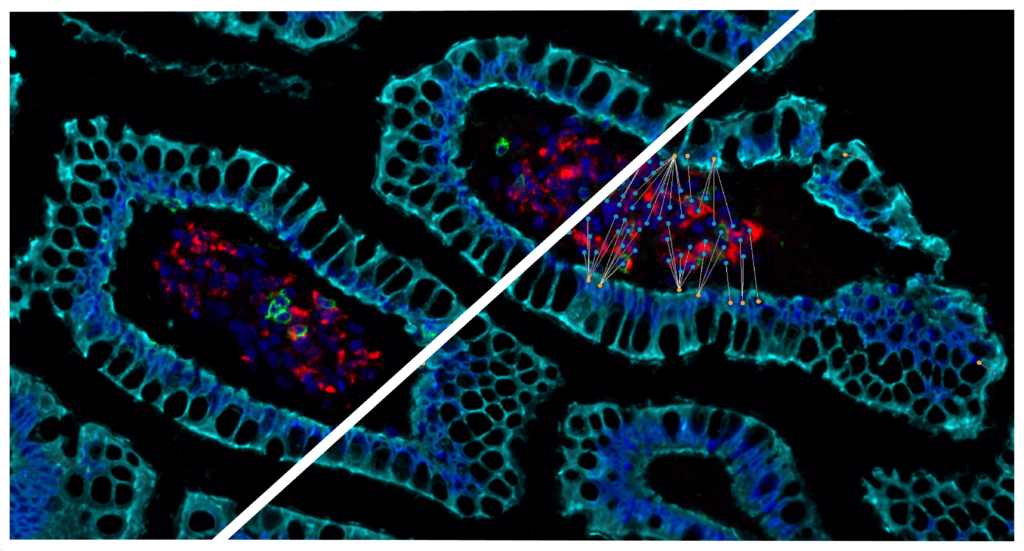
Plot cells and objects from one or more images and perform nearest neighbor analysis, proximity analysis, and tumor infiltration analysis.

Simultaneously analyze an unlimited number of fluorescent nucleic acid probes on a cell-by-cell basis, measuring spot numbers and area per cell and compartment, and calculated H-scores for each probe.
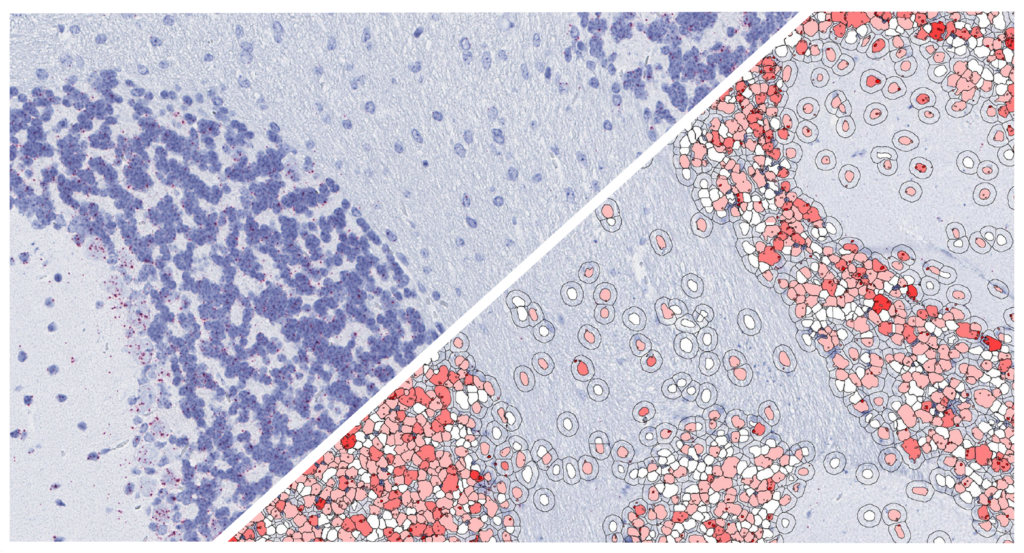
Simultaneously analyze up to three chromogenic and/or silver-labelled DNA or RNA ISH probes on a cell-by-cell basis, measuring spot numbers and area per cell and compartment, and calculated H-scores for each probe.